Weekly/monthly actuals view FAQ
How can I view Harvest actuals in Forecast?
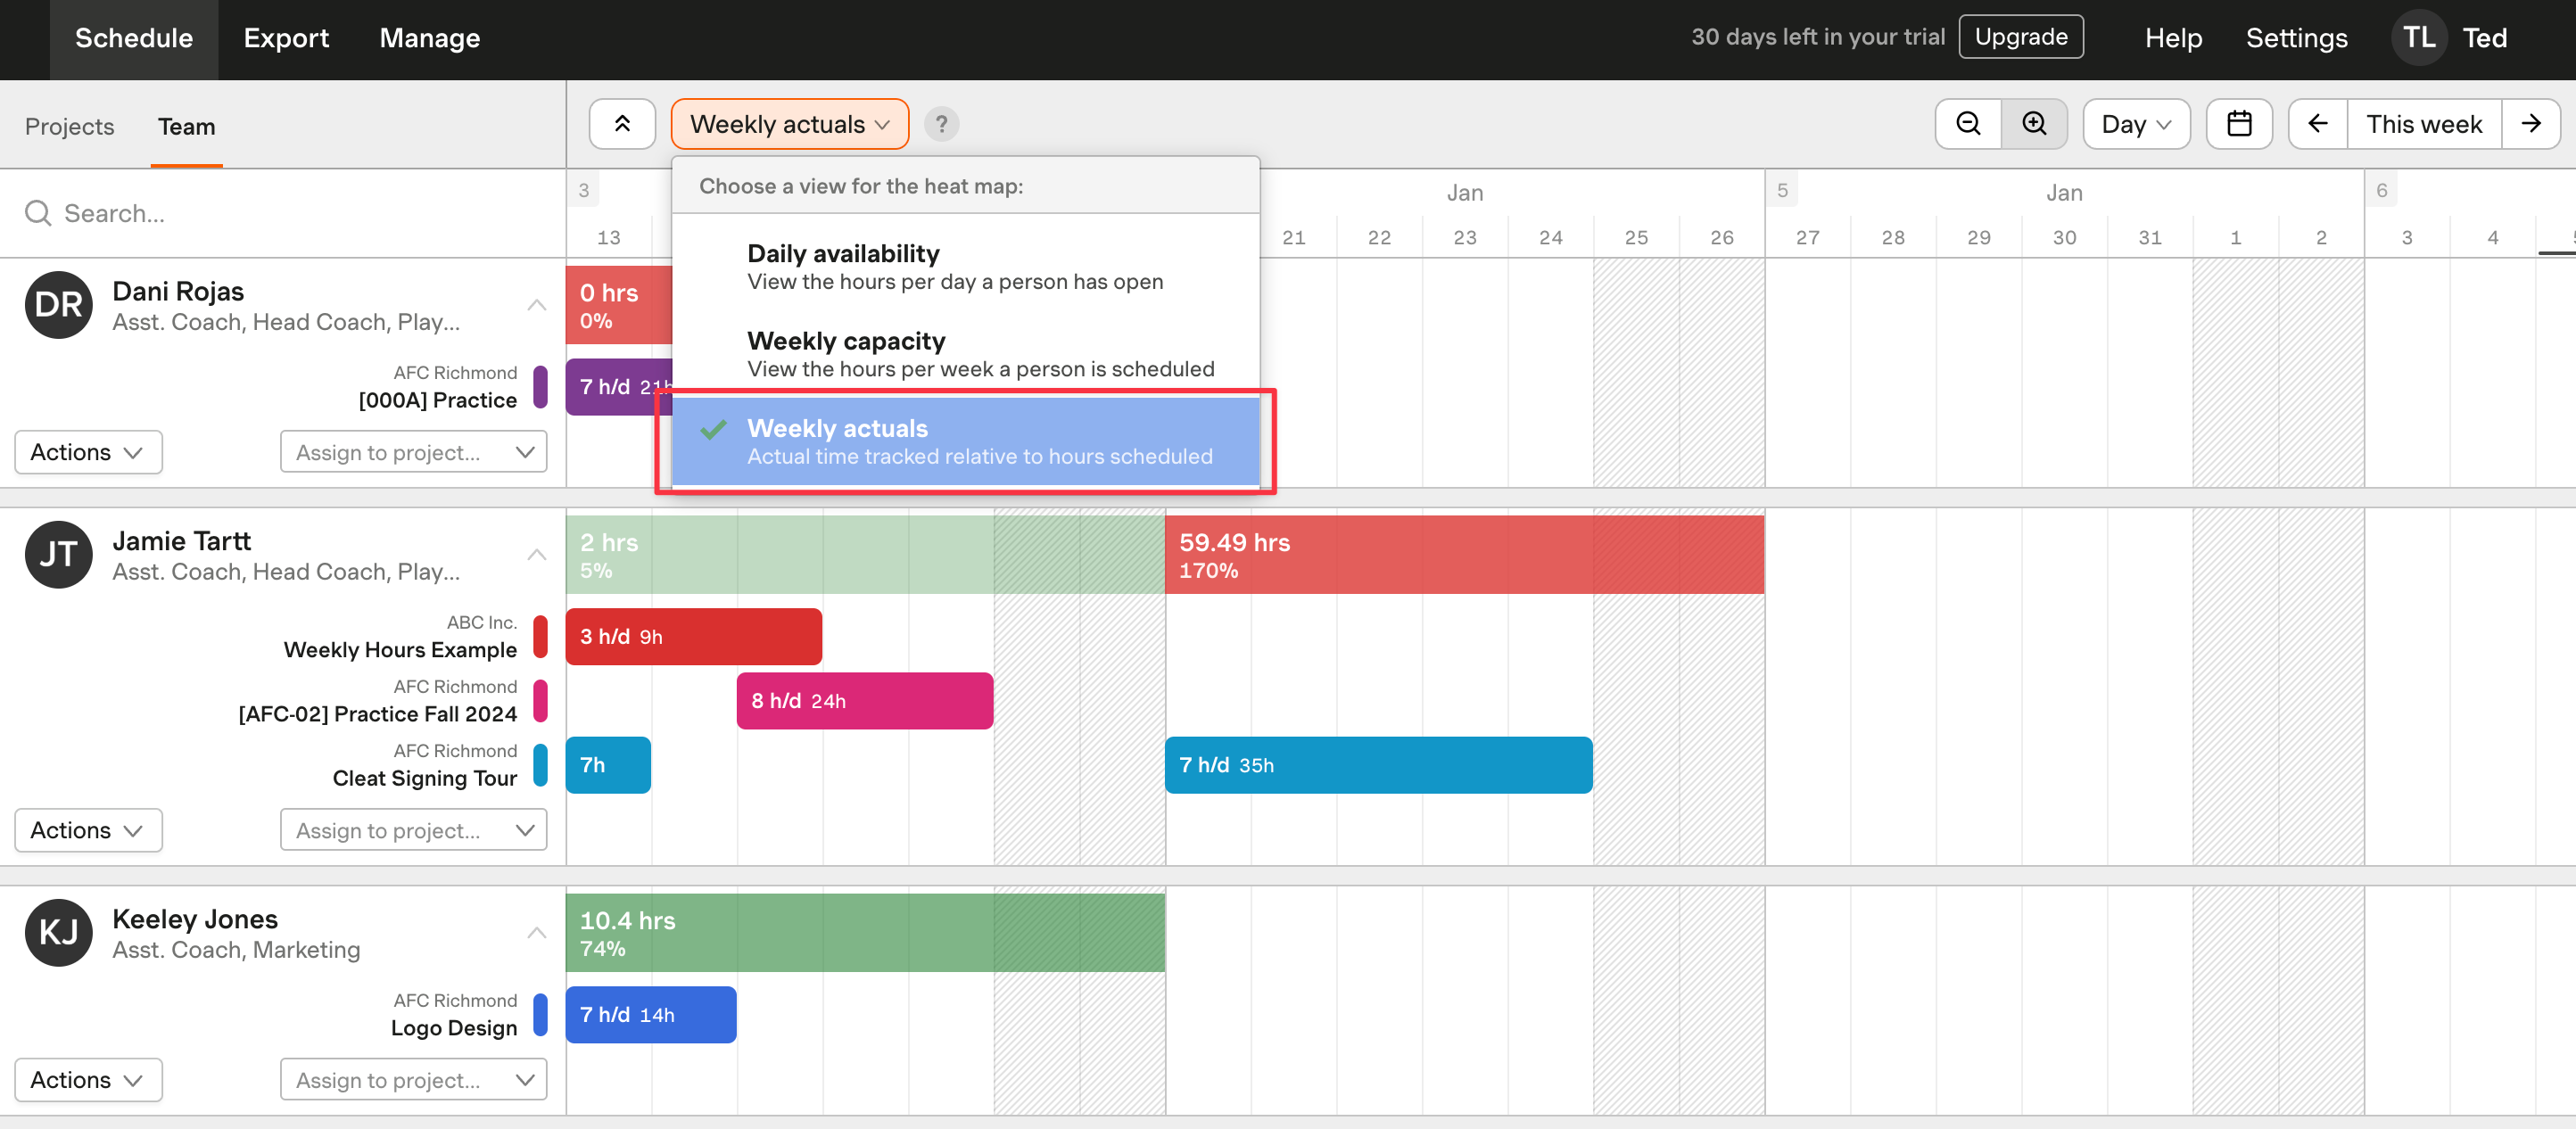
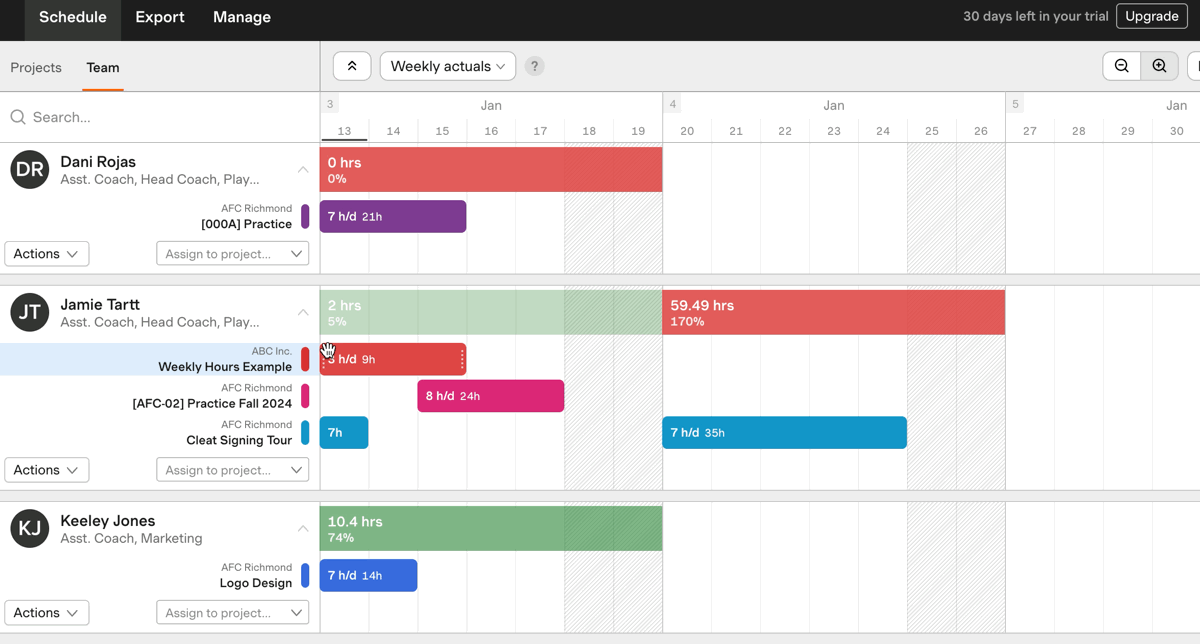
To see your team’s actual tracked time, head to the Team schedule and click the dropdown to choose a view for the heatmap. Select Weekly actuals (if you’re on the Day or Week view) or Monthly actuals (if you’re on the Month view).
What do all the numbers mean?
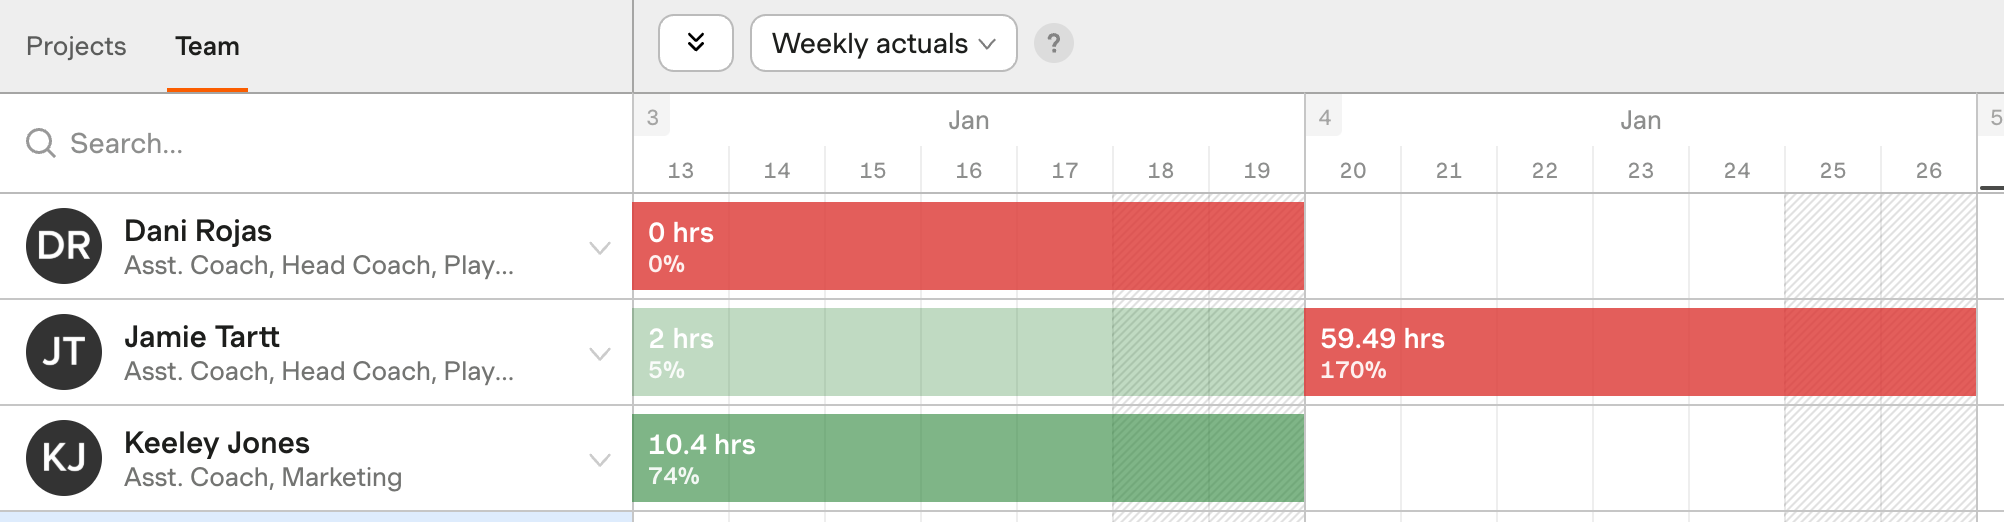
When viewing your team’s Weekly actuals or Monthly actuals, you’ll see:
- The total hours a person has tracked in Harvest to any linked projects for the given week or month
- Hours tracked to projects that aren’t linked between Harvest and Forecast aren’t included in this total
- The percentage (%) of actual hours against the scheduled hours by week or month
- The total scheduled hours for the week or month (when hovering over the percentage)
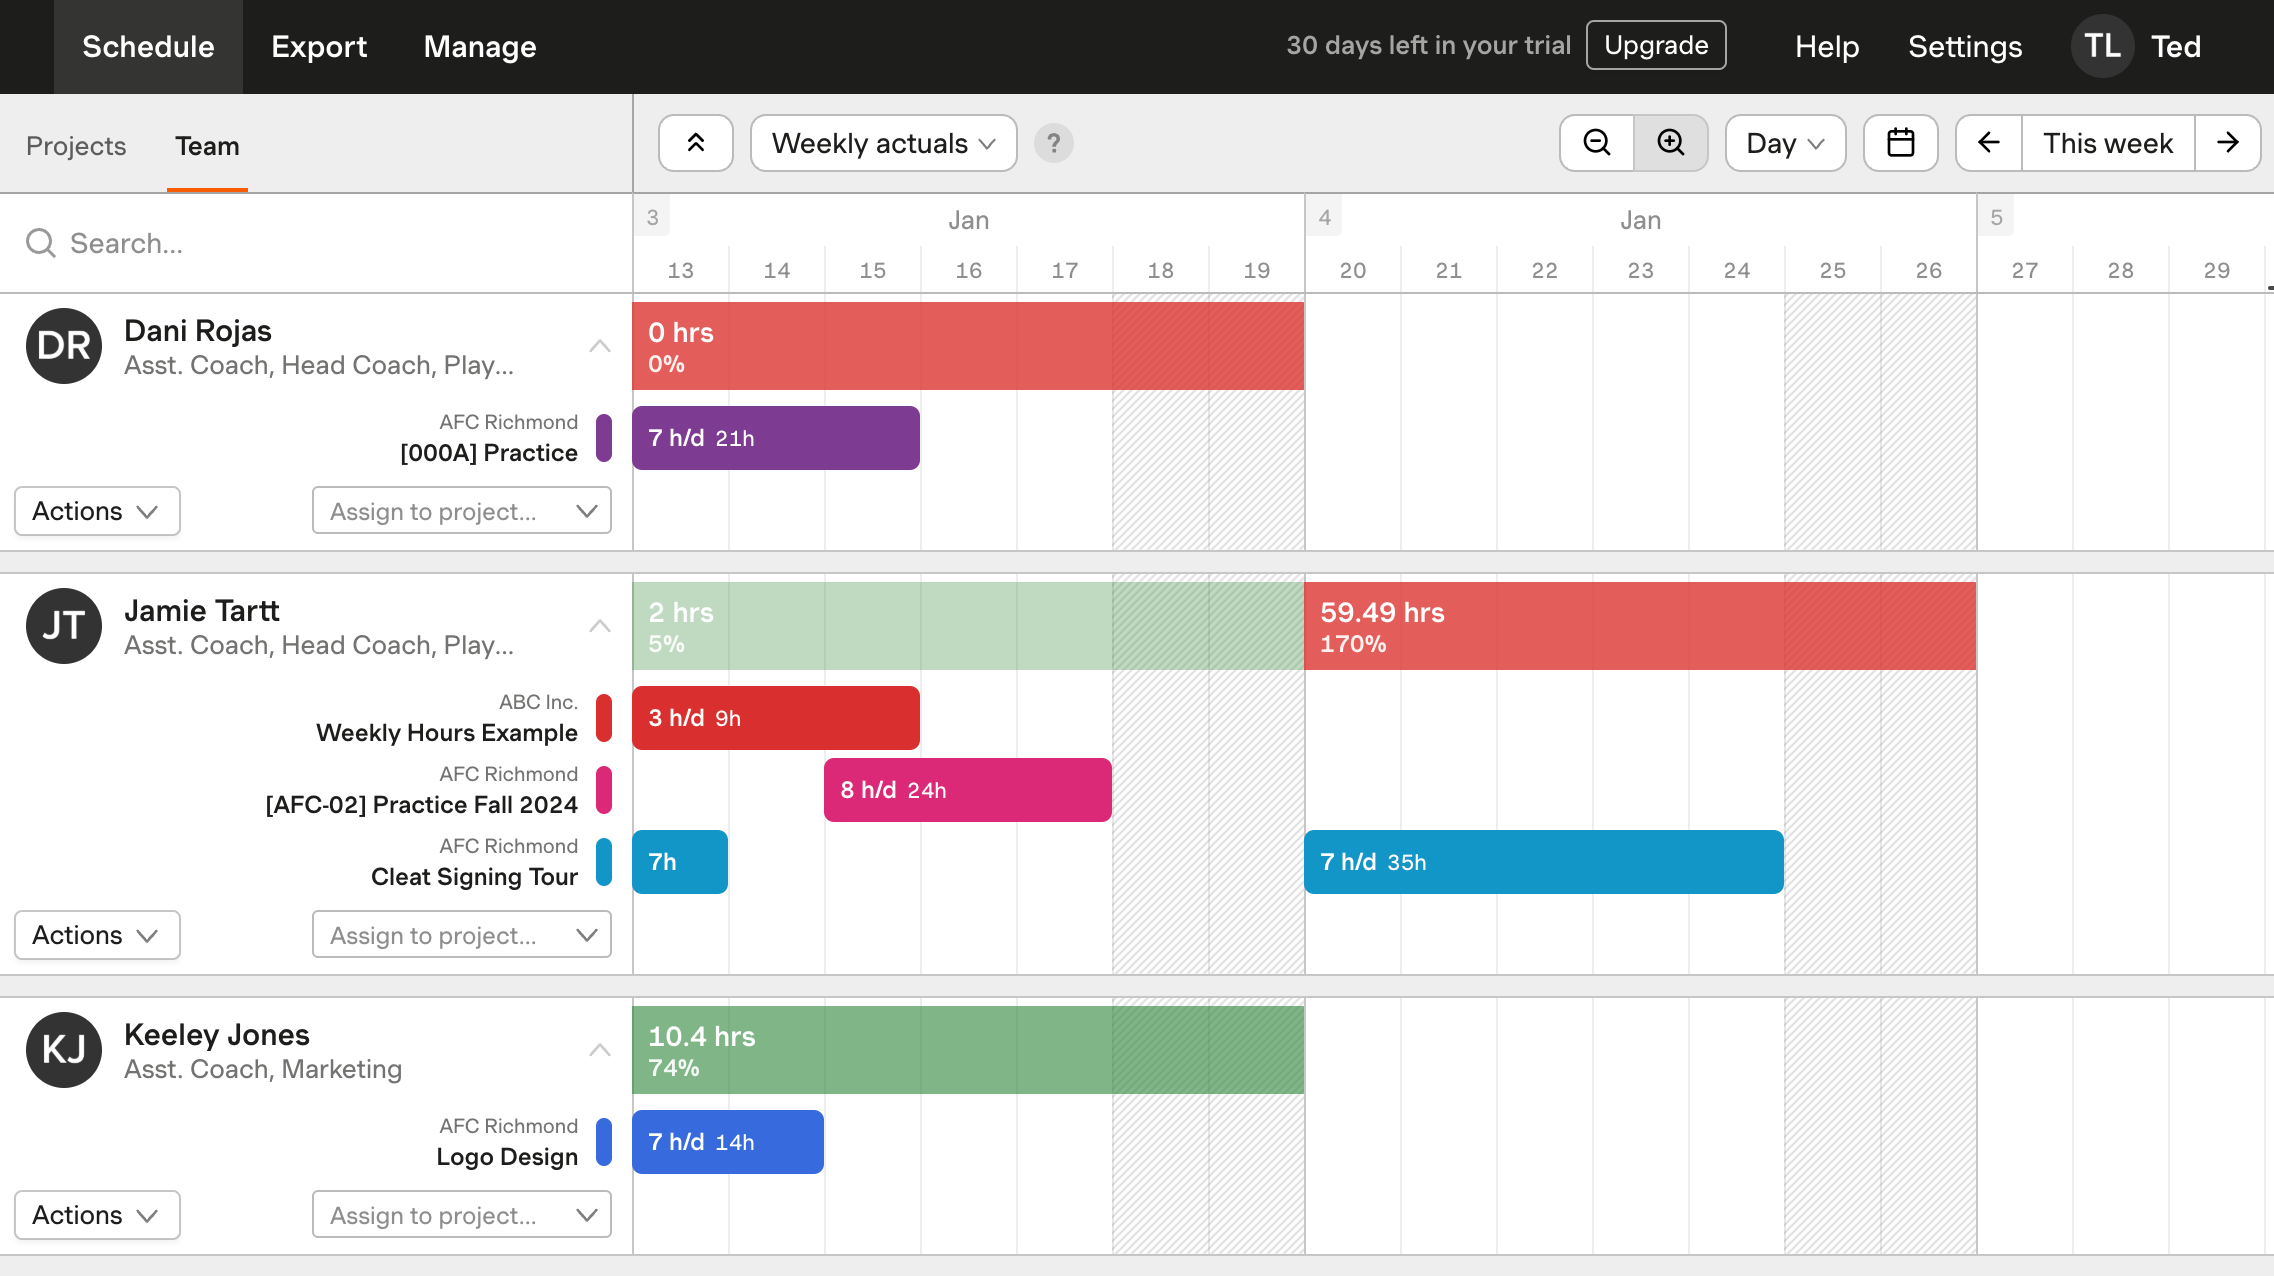
In the above example, Jamie’s scheduled for 40 hours the week of January 13 - 17, but has only tracked 2 hours so far in Harvest, which is 5% of that estimated total.
The following week, Jamie’s scheduled for 35 hours, but has tracked a total of 59.49 hours in Harvest. This means he’s actually tracked 170% of his scheduled time.
How do I see a person’s total scheduled hours for the week or month?
You can hover over the percentage to see the estimated total of scheduled hours in Forecast for the given week or month:
Can I schedule assignments on this view?
Yes. You can create new project assignments, or edit existing assignments, for your team right from this view, and the percentage of actual hours against the scheduled hours will increase or decrease based on the changes you make.
What do the different colors mean?
Green means the person has tracked fewer hours in Harvest than they’re scheduled for in Forecast, or their actual hours equal their scheduled hours.
- A light green indicates the person still has a large gap between their scheduled hours and actual hours.
- A dark green indicates they’re close to matching their scheduled hours.
Red means one of two things:
- The person has tracked more time in Harvest than they’re scheduled for in Forecast, i.e. a percentage above 100%
- A past week or month has no tracked time but had scheduled hours in Forecast, meaning they’ve tracked 0% of their scheduled hours.
- Current or future weeks/months won’t appear red, even if there’s no tracked time.
What timeframes are available?
You can view weekly actuals (Day or Week view) or monthly actuals (Month view).
How can I see the projects associated with my team’s actual tracked time?
To see which projects they’ve tracked time to, you’ll need to head to the corresponding time report or timesheet in Harvest.
How is the percentage calculated?
Actual hours divided by scheduled hours. If a person tracks 10 hours and they’re scheduled for 20 hours, you’ll see 50%.